Mabel is an artisan bakery in East Ballina, on the NSW North Coast. Josh, the owner, makes everything from sourdough to croissants to beef pies. Every week, the same decision: what to make, how many, and when.
His words: “The numbers are adjusted by a mix of data and feel.”
Ten months of Square data had the patterns. Pulling them apart manually would take hours.
The spike: where I started
The spike was working: Claude processing Square transaction data, reasoning about weekly averages, weighting recent weeks, factoring in public holidays. Except the numbers were drifting half the time.
The problem was I’d given Claude the precision task. It was reasoning about quantities and landing on different numbers each run, which forced a rethink, not just of the implementation, but of what Claude’s role in the system should be at all.
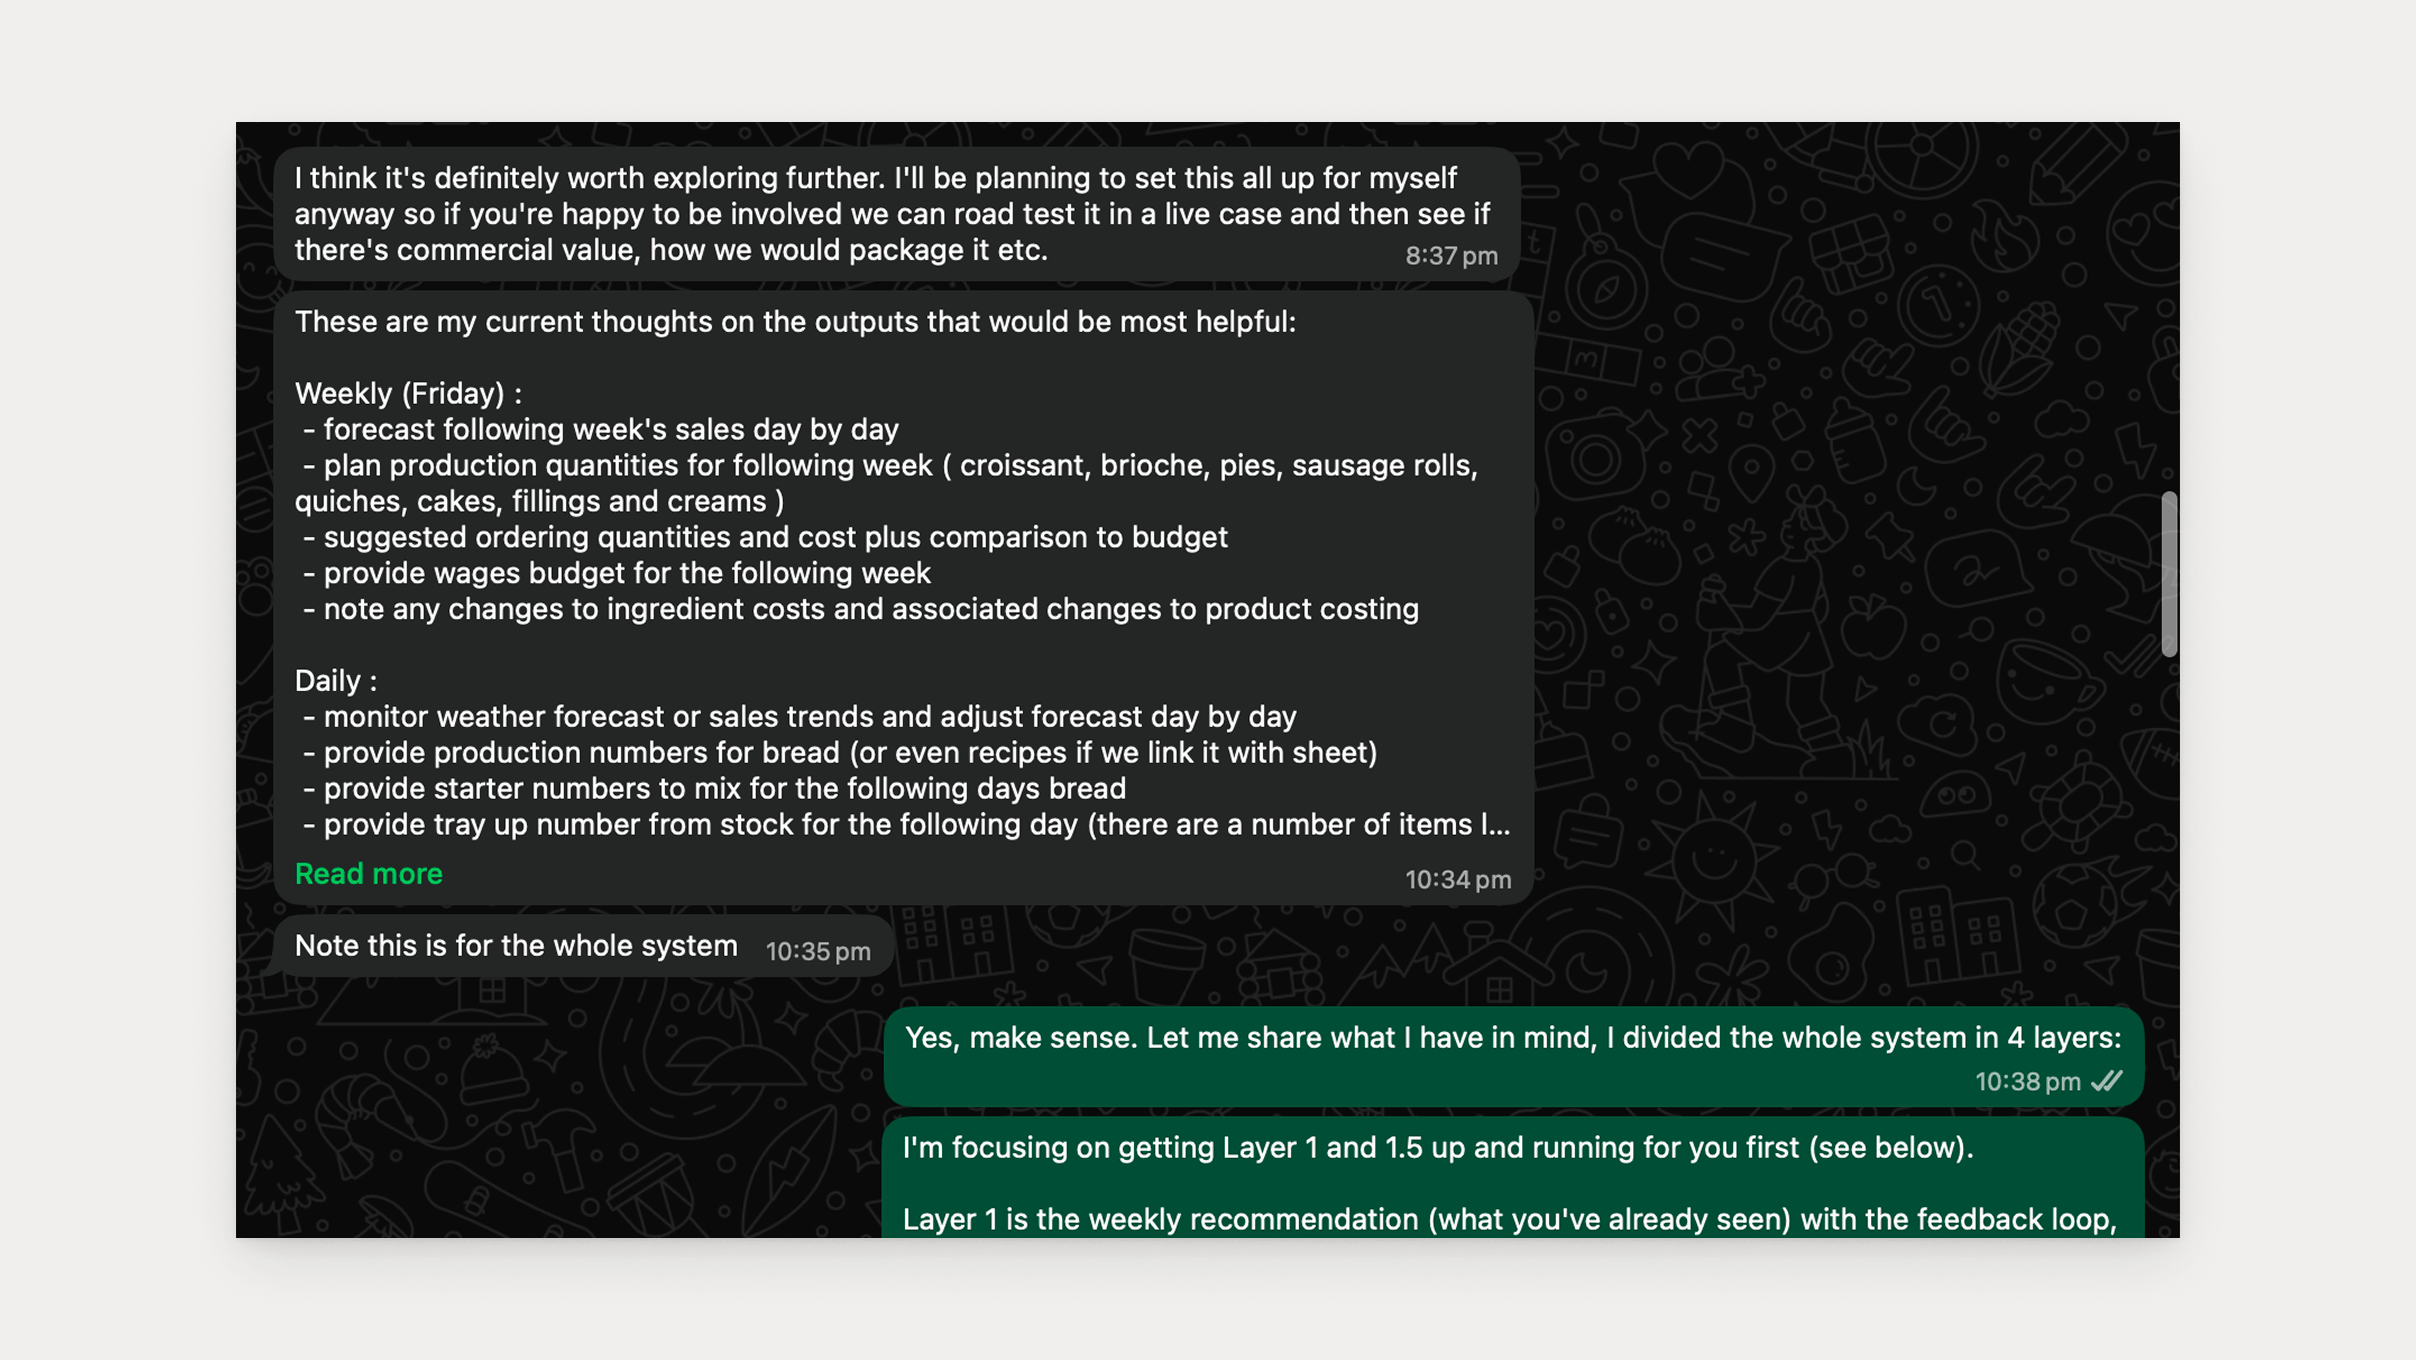
Aviato’s four-layer agent architecture put it clearly: a Layer 2 agent wraps an LLM in code. The LLM is a component. The agent is the system around it.
The course correction: Code computes. Claude narrates. Josh decides.

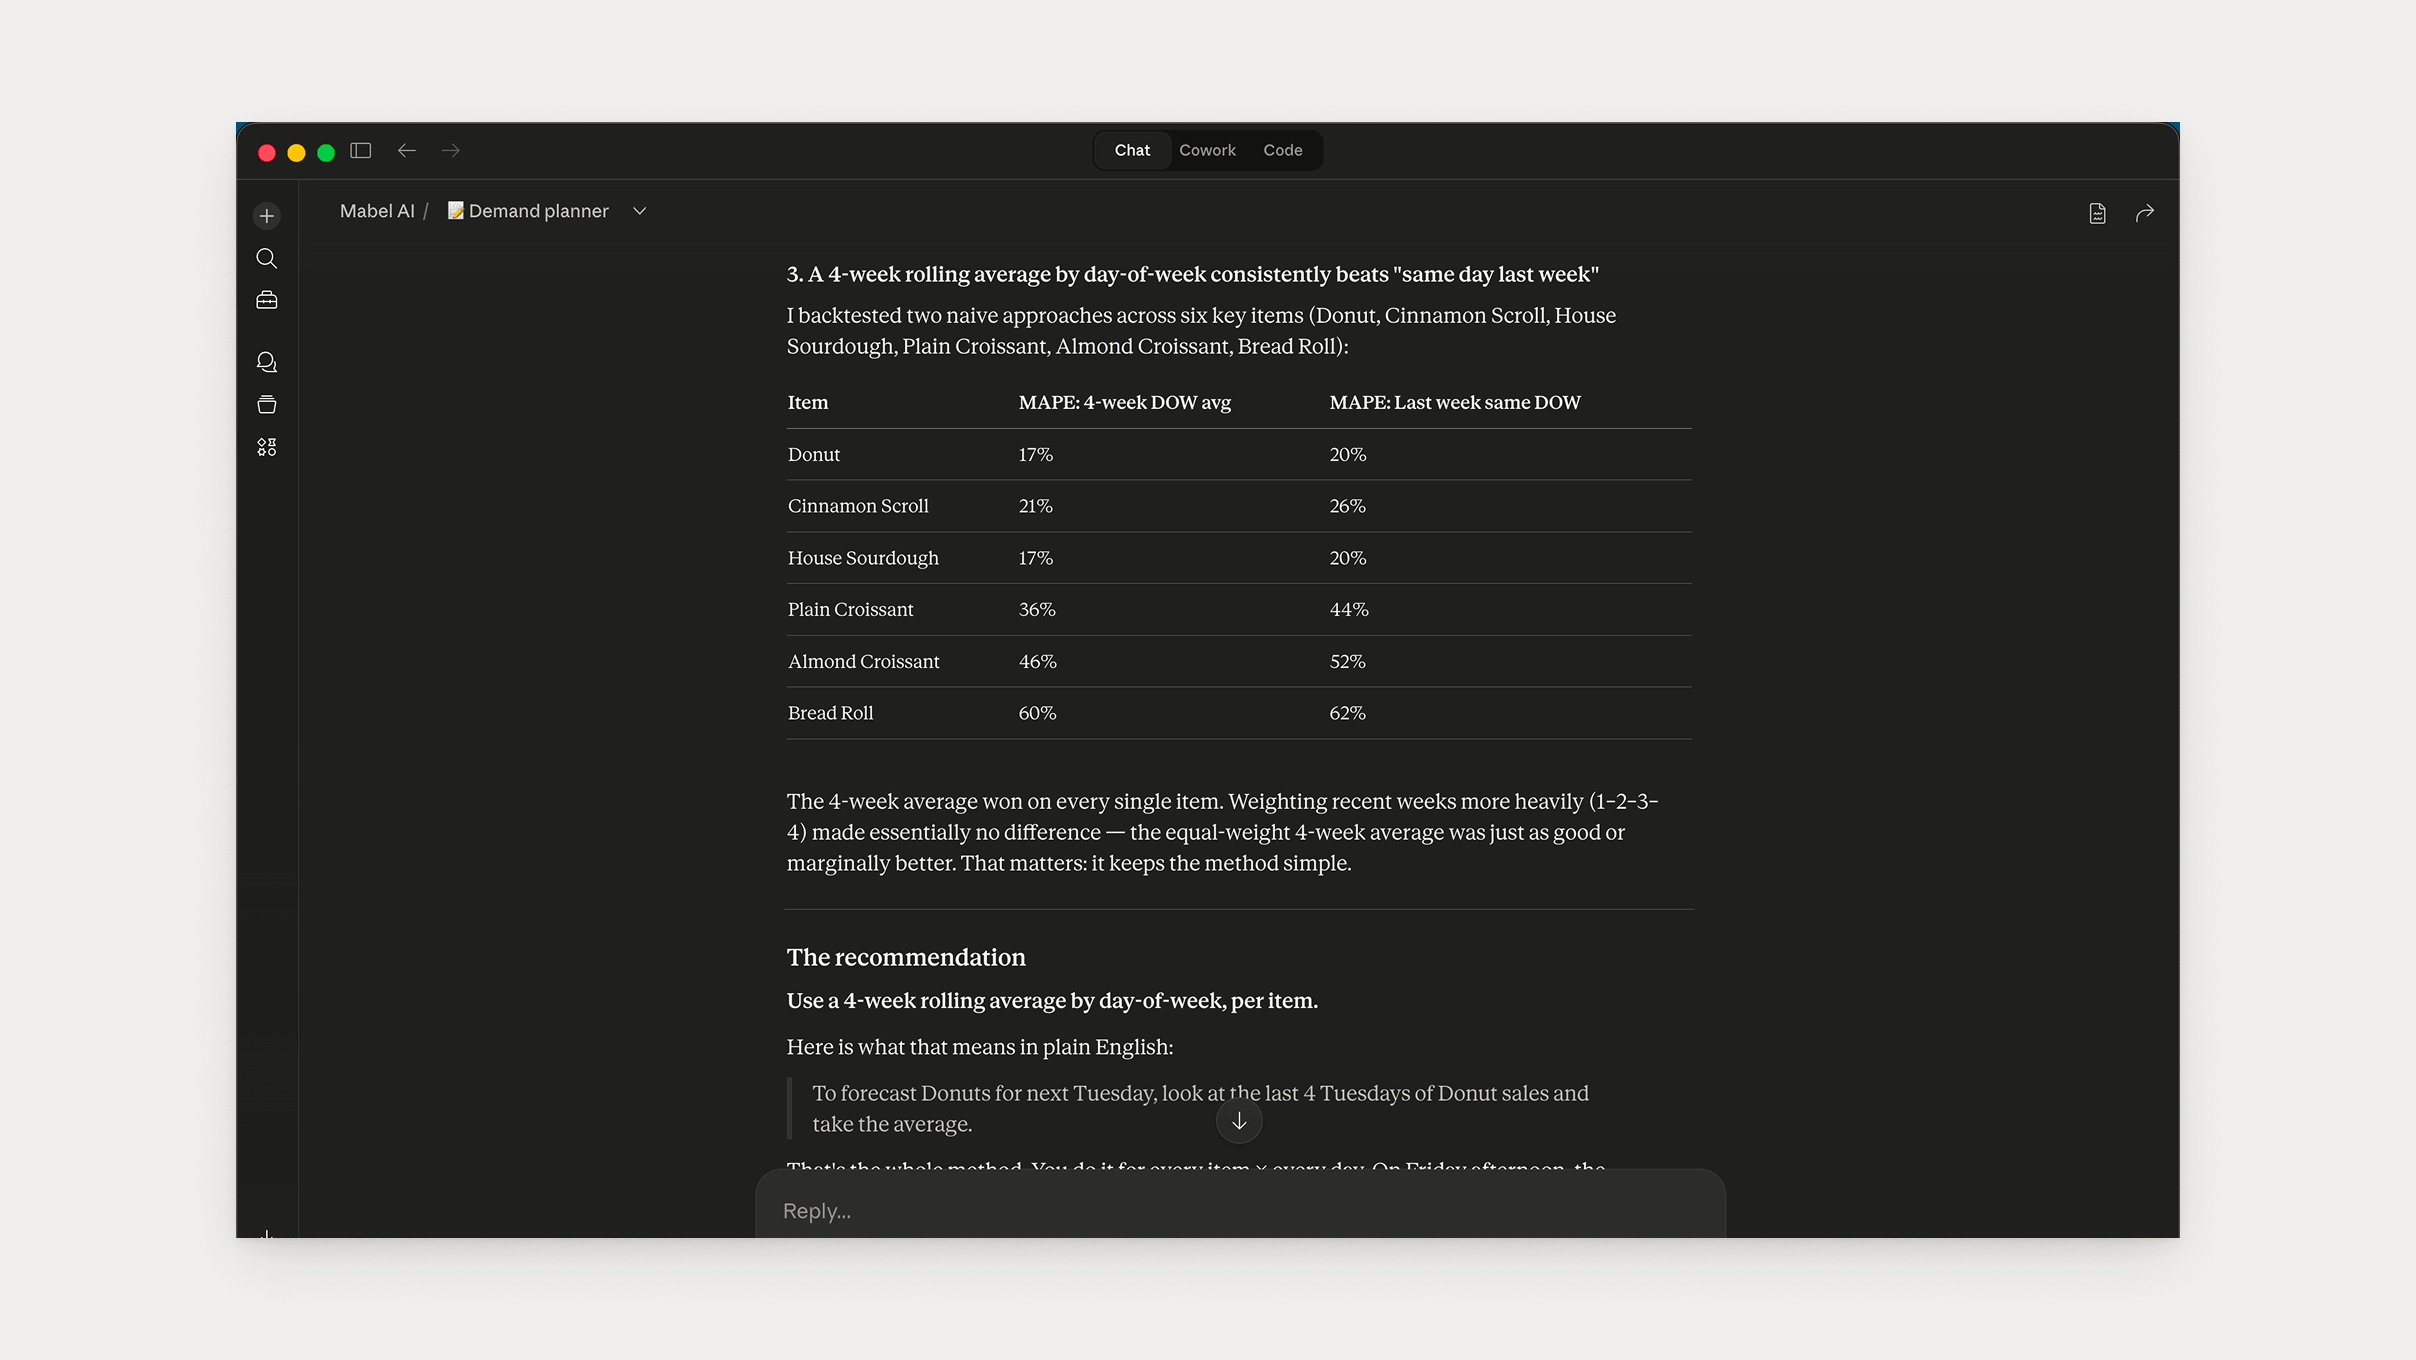
With the architecture corrected, the next question was the forecast method. I ran one analytical query against the full dataset, 94,633 transaction line items across ten months of actual trading, and asked Claude for the best forecasting approach.
The answer was simpler than I expected: 4-week rolling average by day-of-week, per product, equal weights. To forecast Donuts for next Tuesday, average the last four Tuesdays. Josh can verify any number in 30 seconds.
The data also surfaced two things that shaped everything after.
Zeros are ambiguous. A zero doesn’t mean no demand. It means Josh didn’t bake it that day, or sold out early. So the rolling average uses only the last four weeks with non-zero sales.
Some ceilings are production limits, not demand limits. Seeded Loaf on Thursdays never exceeded 6 units, not once. The system can’t know if that’s demand or a fixed bake quantity. Only Josh knows.
Both cases pointed to the same boundary: the system could detect the signal, but not interpret it.
The system flags it. Josh decides.
That boundary didn’t just support the architecture decision. It held across every design decision that followed.
What I got wrong, and what I moved
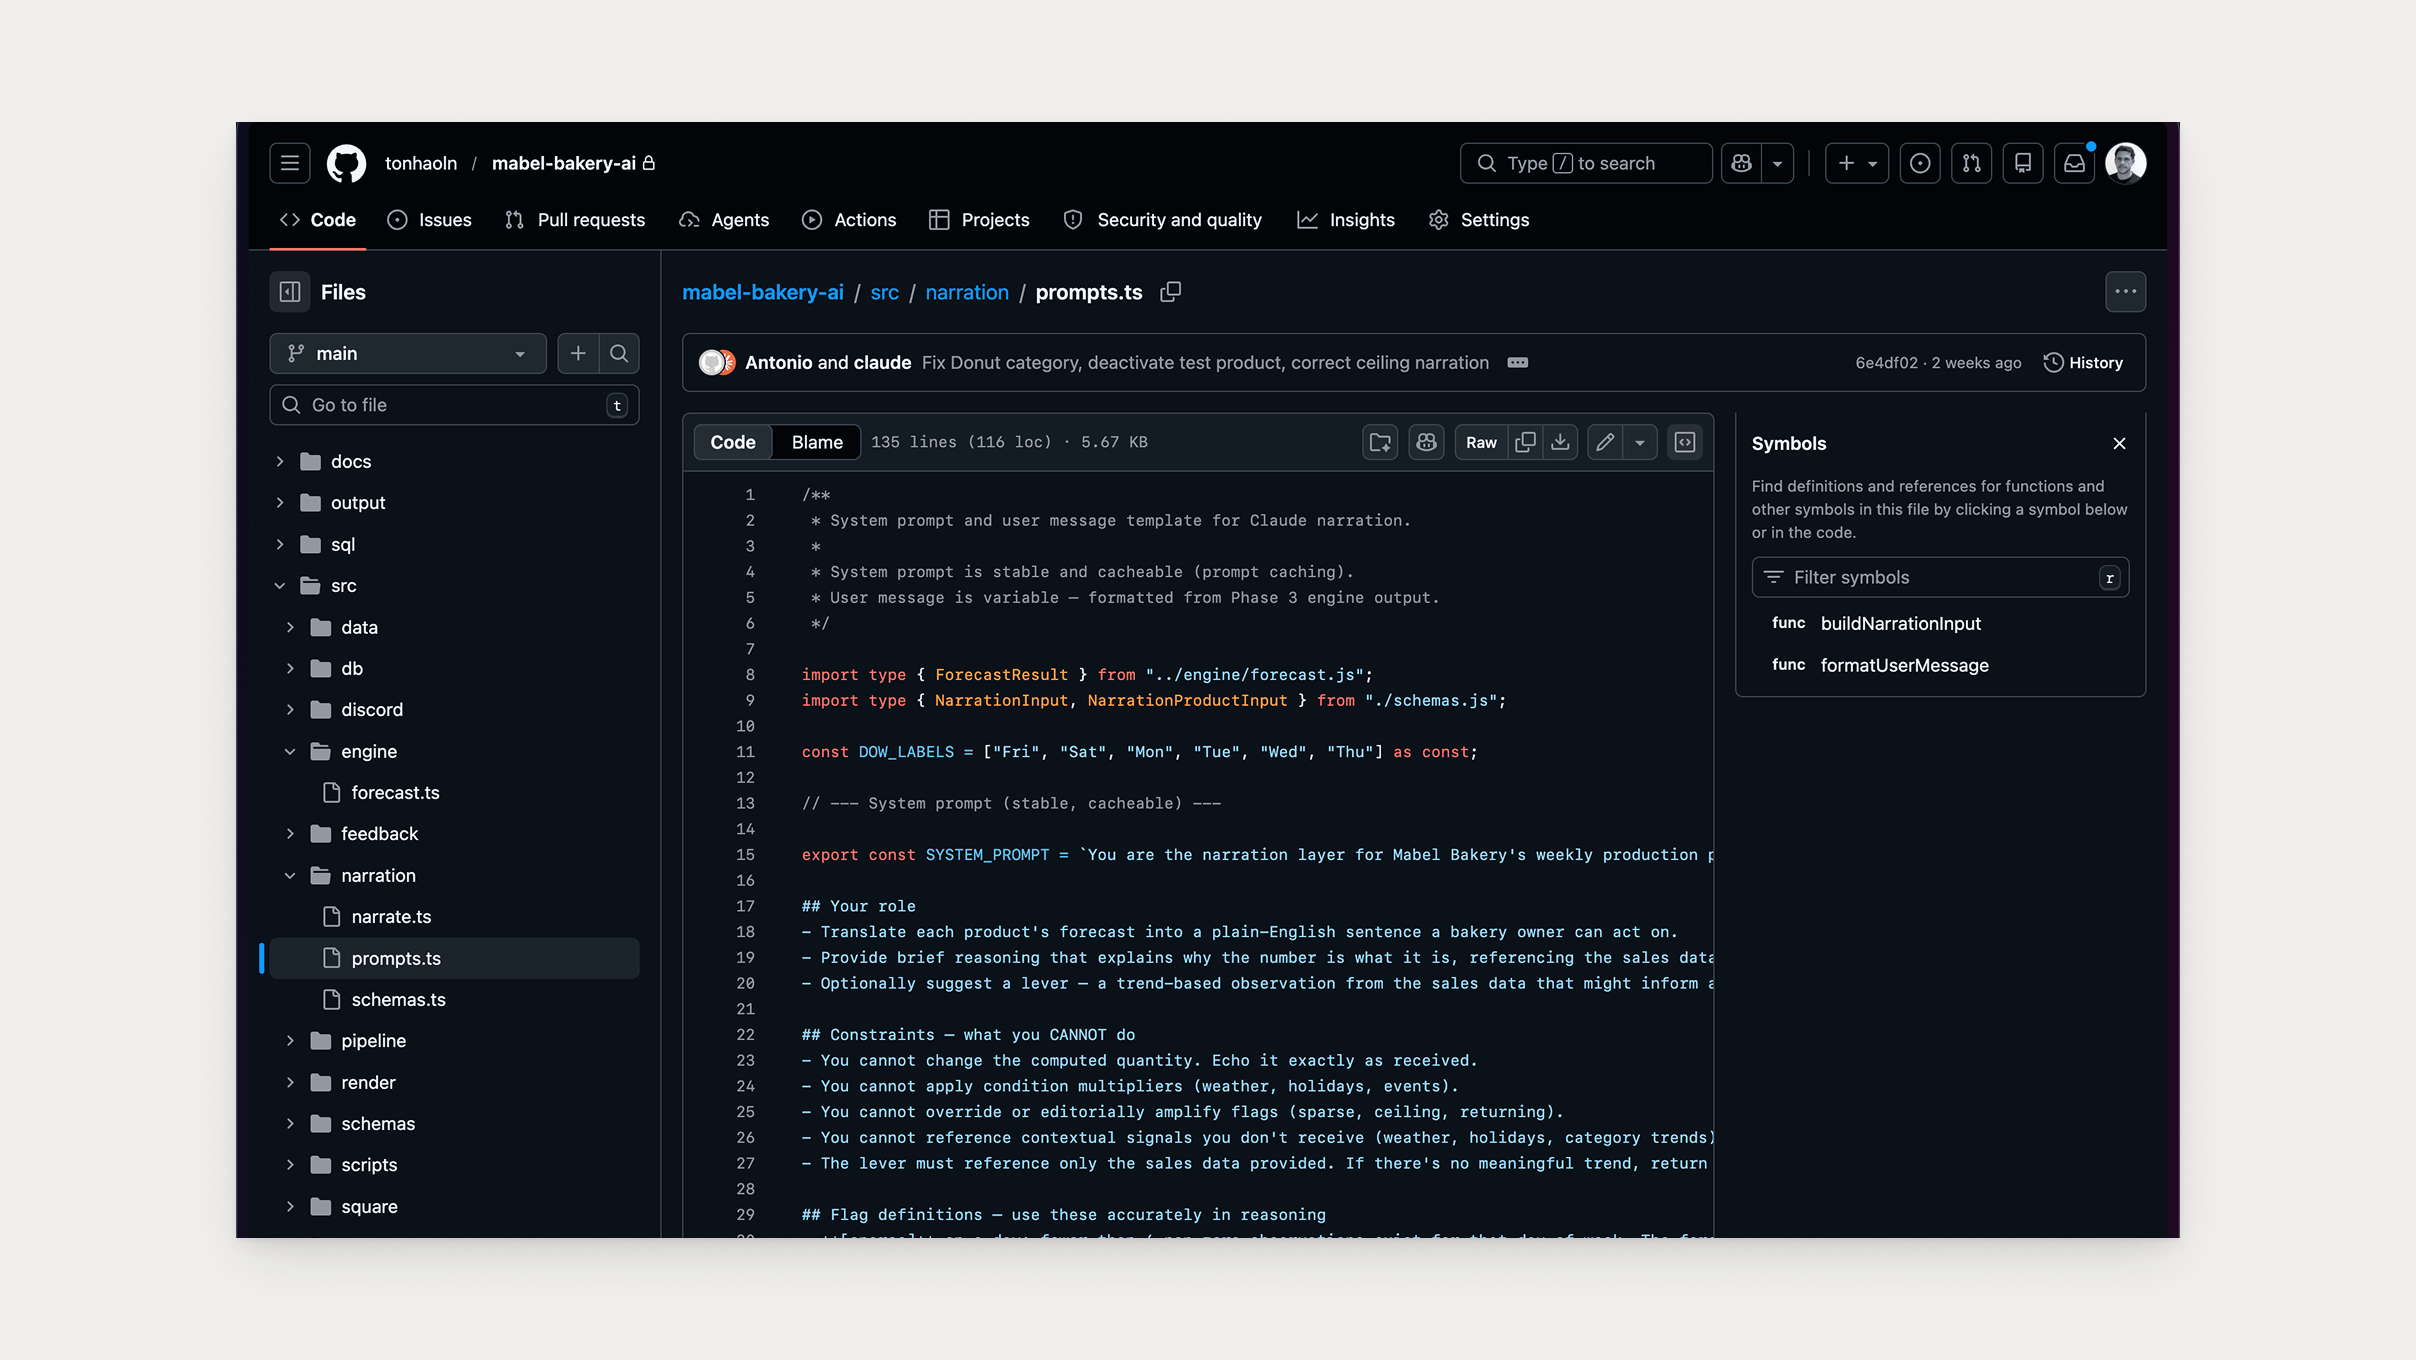
Moving computation out of the prompt. The original design had the formula inside Claude’s prompt: start with the 4-week average, clamp to bounds, round to nearest 5. Claude was instructed to follow it. At any temperature, Claude drifts on computation across runs, so the fix was to move every calculation into code. Claude receives a fixed number. It can’t change what doesn’t exist in its context.
The guardrail went from “Claude is told not to change the number” to “there is no number for Claude to change.”
Category trends through the back door. The forecasting query session had explicitly excluded category trends. Tested as a signal, they degraded accuracy on every item. But the design still had Claude narrating them: “Croissants are down 16% this week. Worth watching.” It has the grammar of advice but not the grounding. Category trends still appear in the report as a number because Josh wanted visibility. Code prints them. Claude doesn’t narrate them.
The feedback loop data poisoning risk. The original design assumed silence meant compliance. No reply from Josh meant produced equals recommended. Josh is in a bakery at 3am and he won’t reply most days, so after eight weeks the produced column would be mostly fabricated. So silence means null, never assumed, never backfilled. The system depends only on what Square confirms automatically. Everything else adds resolution when available and its absence doesn’t break anything.
The build
By now Claude Code had everything it needed: the design decisions, the spike environment and a plan with seven phases, each with a gate. Pass the criteria, move to the next.
The plan said 29 active products but the first Square sync told a different story. 67,189 line items had been rejected, and buried in those rejections were pies, sausage rolls, quiche, toasties and filled rolls. Real production items Josh makes every day. The decision was immediate: everything in. A forecast Josh ignores is harmless but a forecast that doesn’t exist can’t help him. The registry went from 29 to 56 products.
The forecasting engine came together cleanly. Sales data in, quantities and flags out, the 4-week rolling average running exactly as specified with non-zero observations, outlier exclusion and floor and ceiling bounds. Then the pipeline: Square sync, forecasting engine, Claude narration and output rendering, running in sequence every Friday at 3am AEST, exactly as designed.
If Square is down the report still posts on stale data because a late sync is better than no forecast. If the weather API is down the weather line drops and nothing else changes. Anything else and the pipeline stops. Nothing partial ever posts.
A forecast Josh ignores is harmless but a forecast that doesn’t exist can’t help him.
The spike was the education. The second build took four hours.
What Josh gets
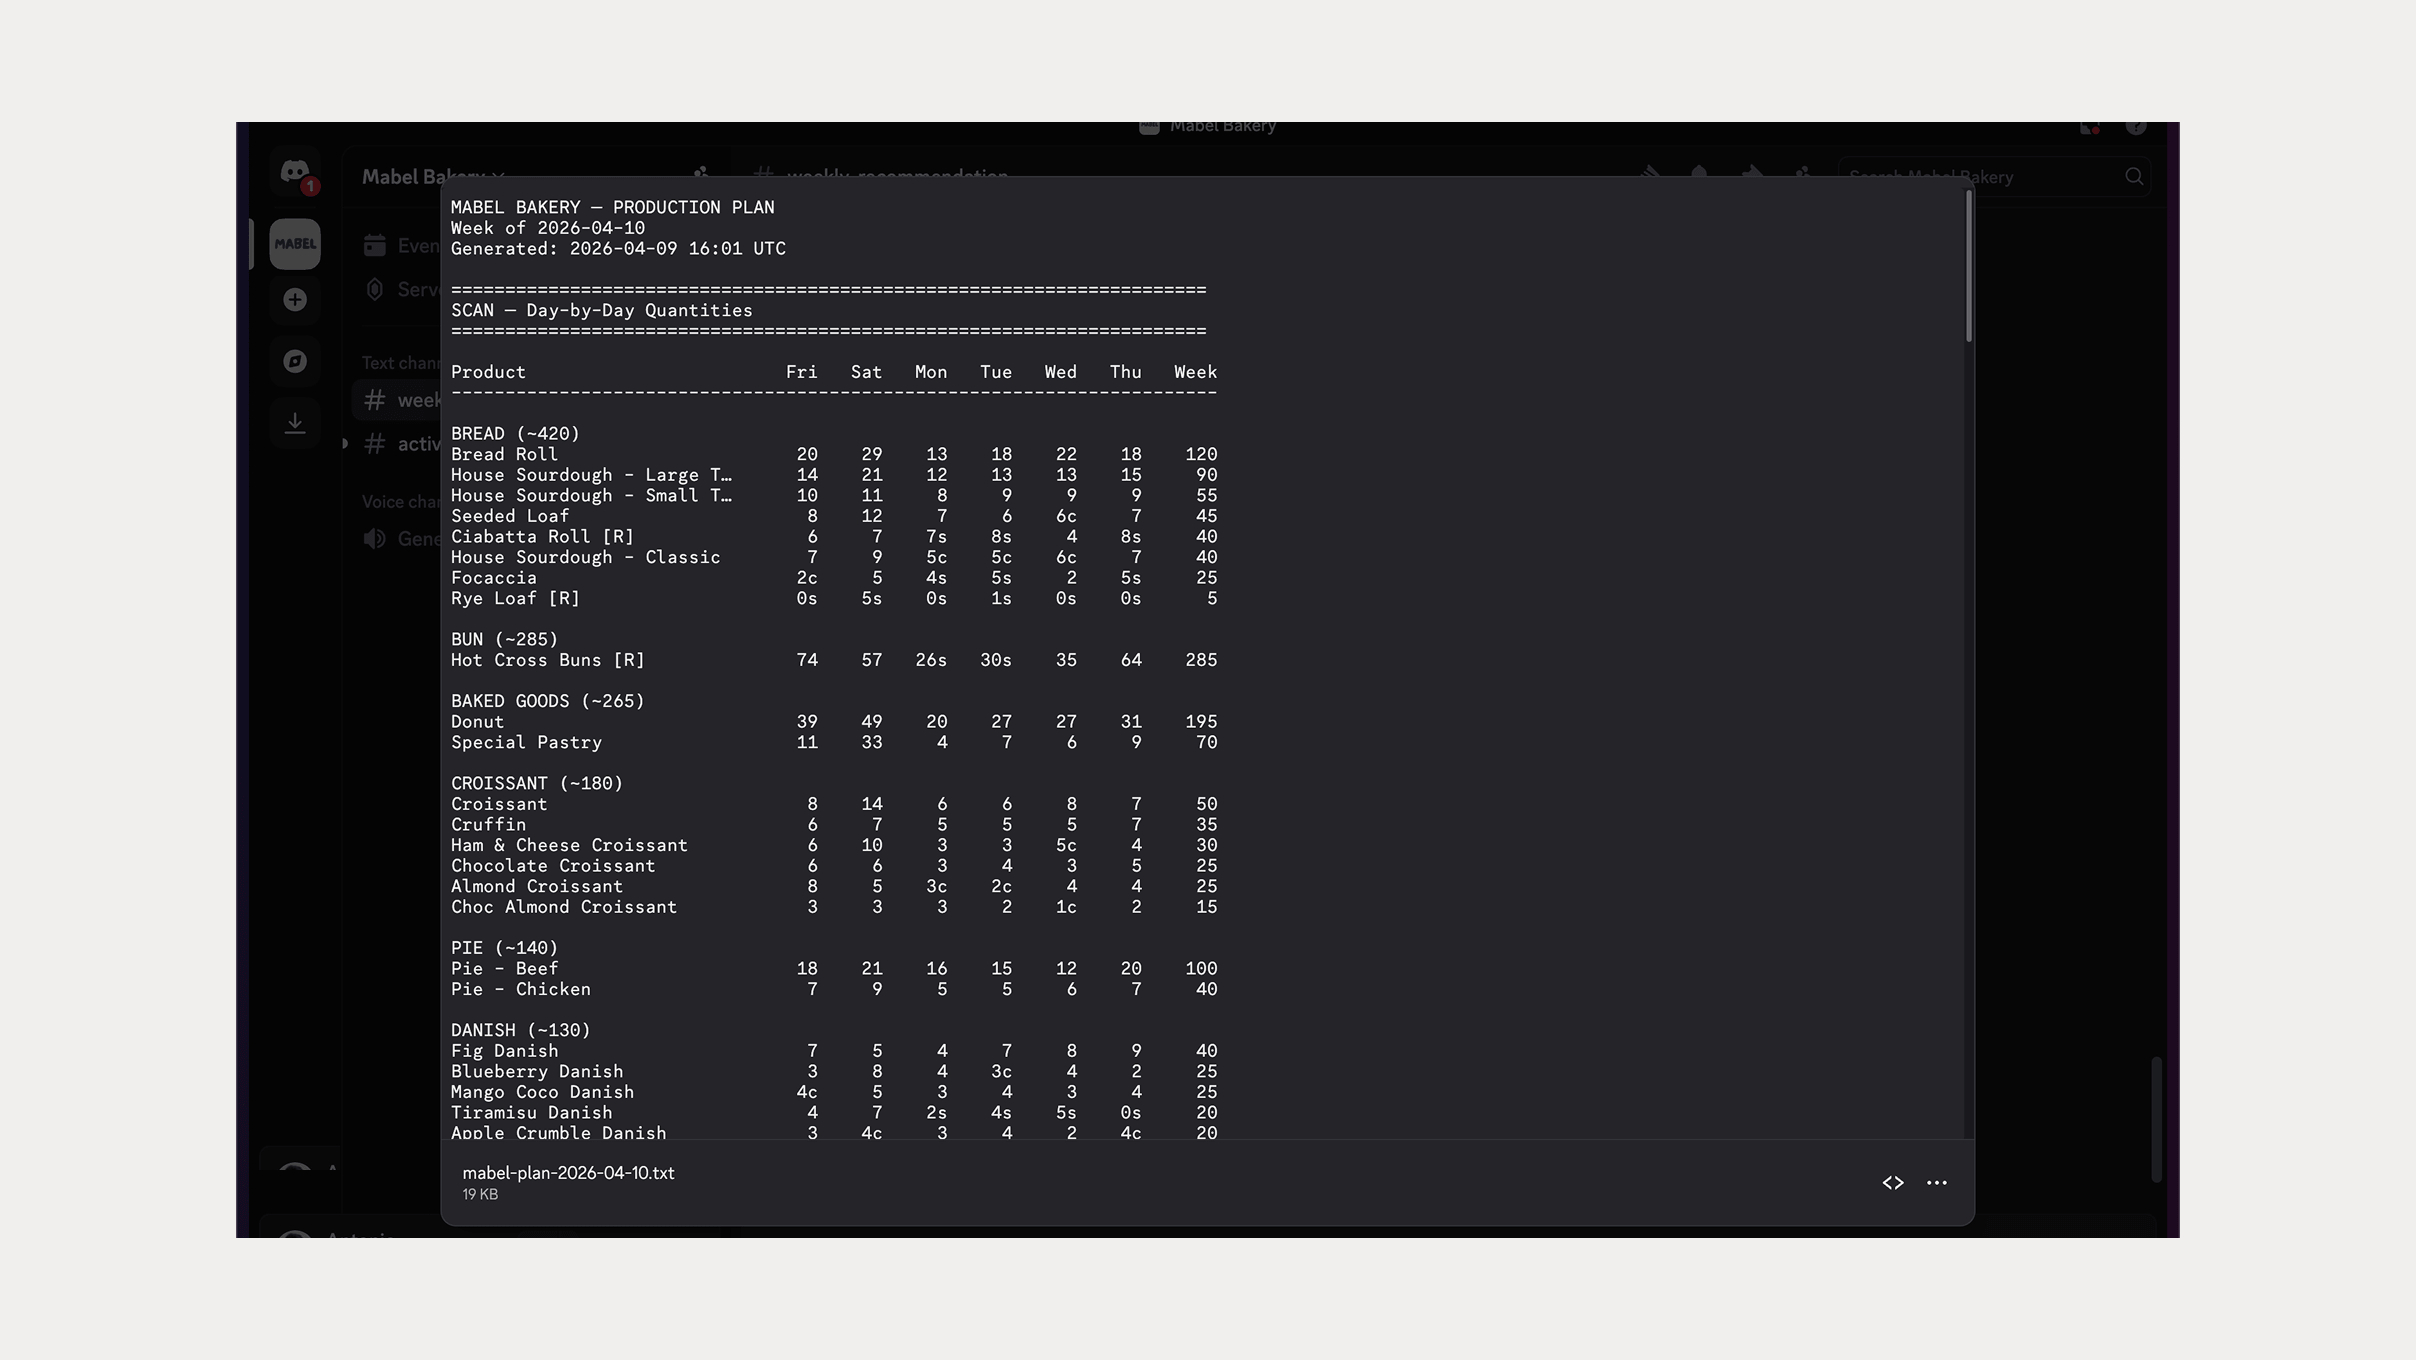
Every Friday at 3am, the agent pulls the previous week’s transaction data, computes the 4-week rolling average by day-of-week, per product, and narrates the results in plain English. The report lands in Discord on his phone.
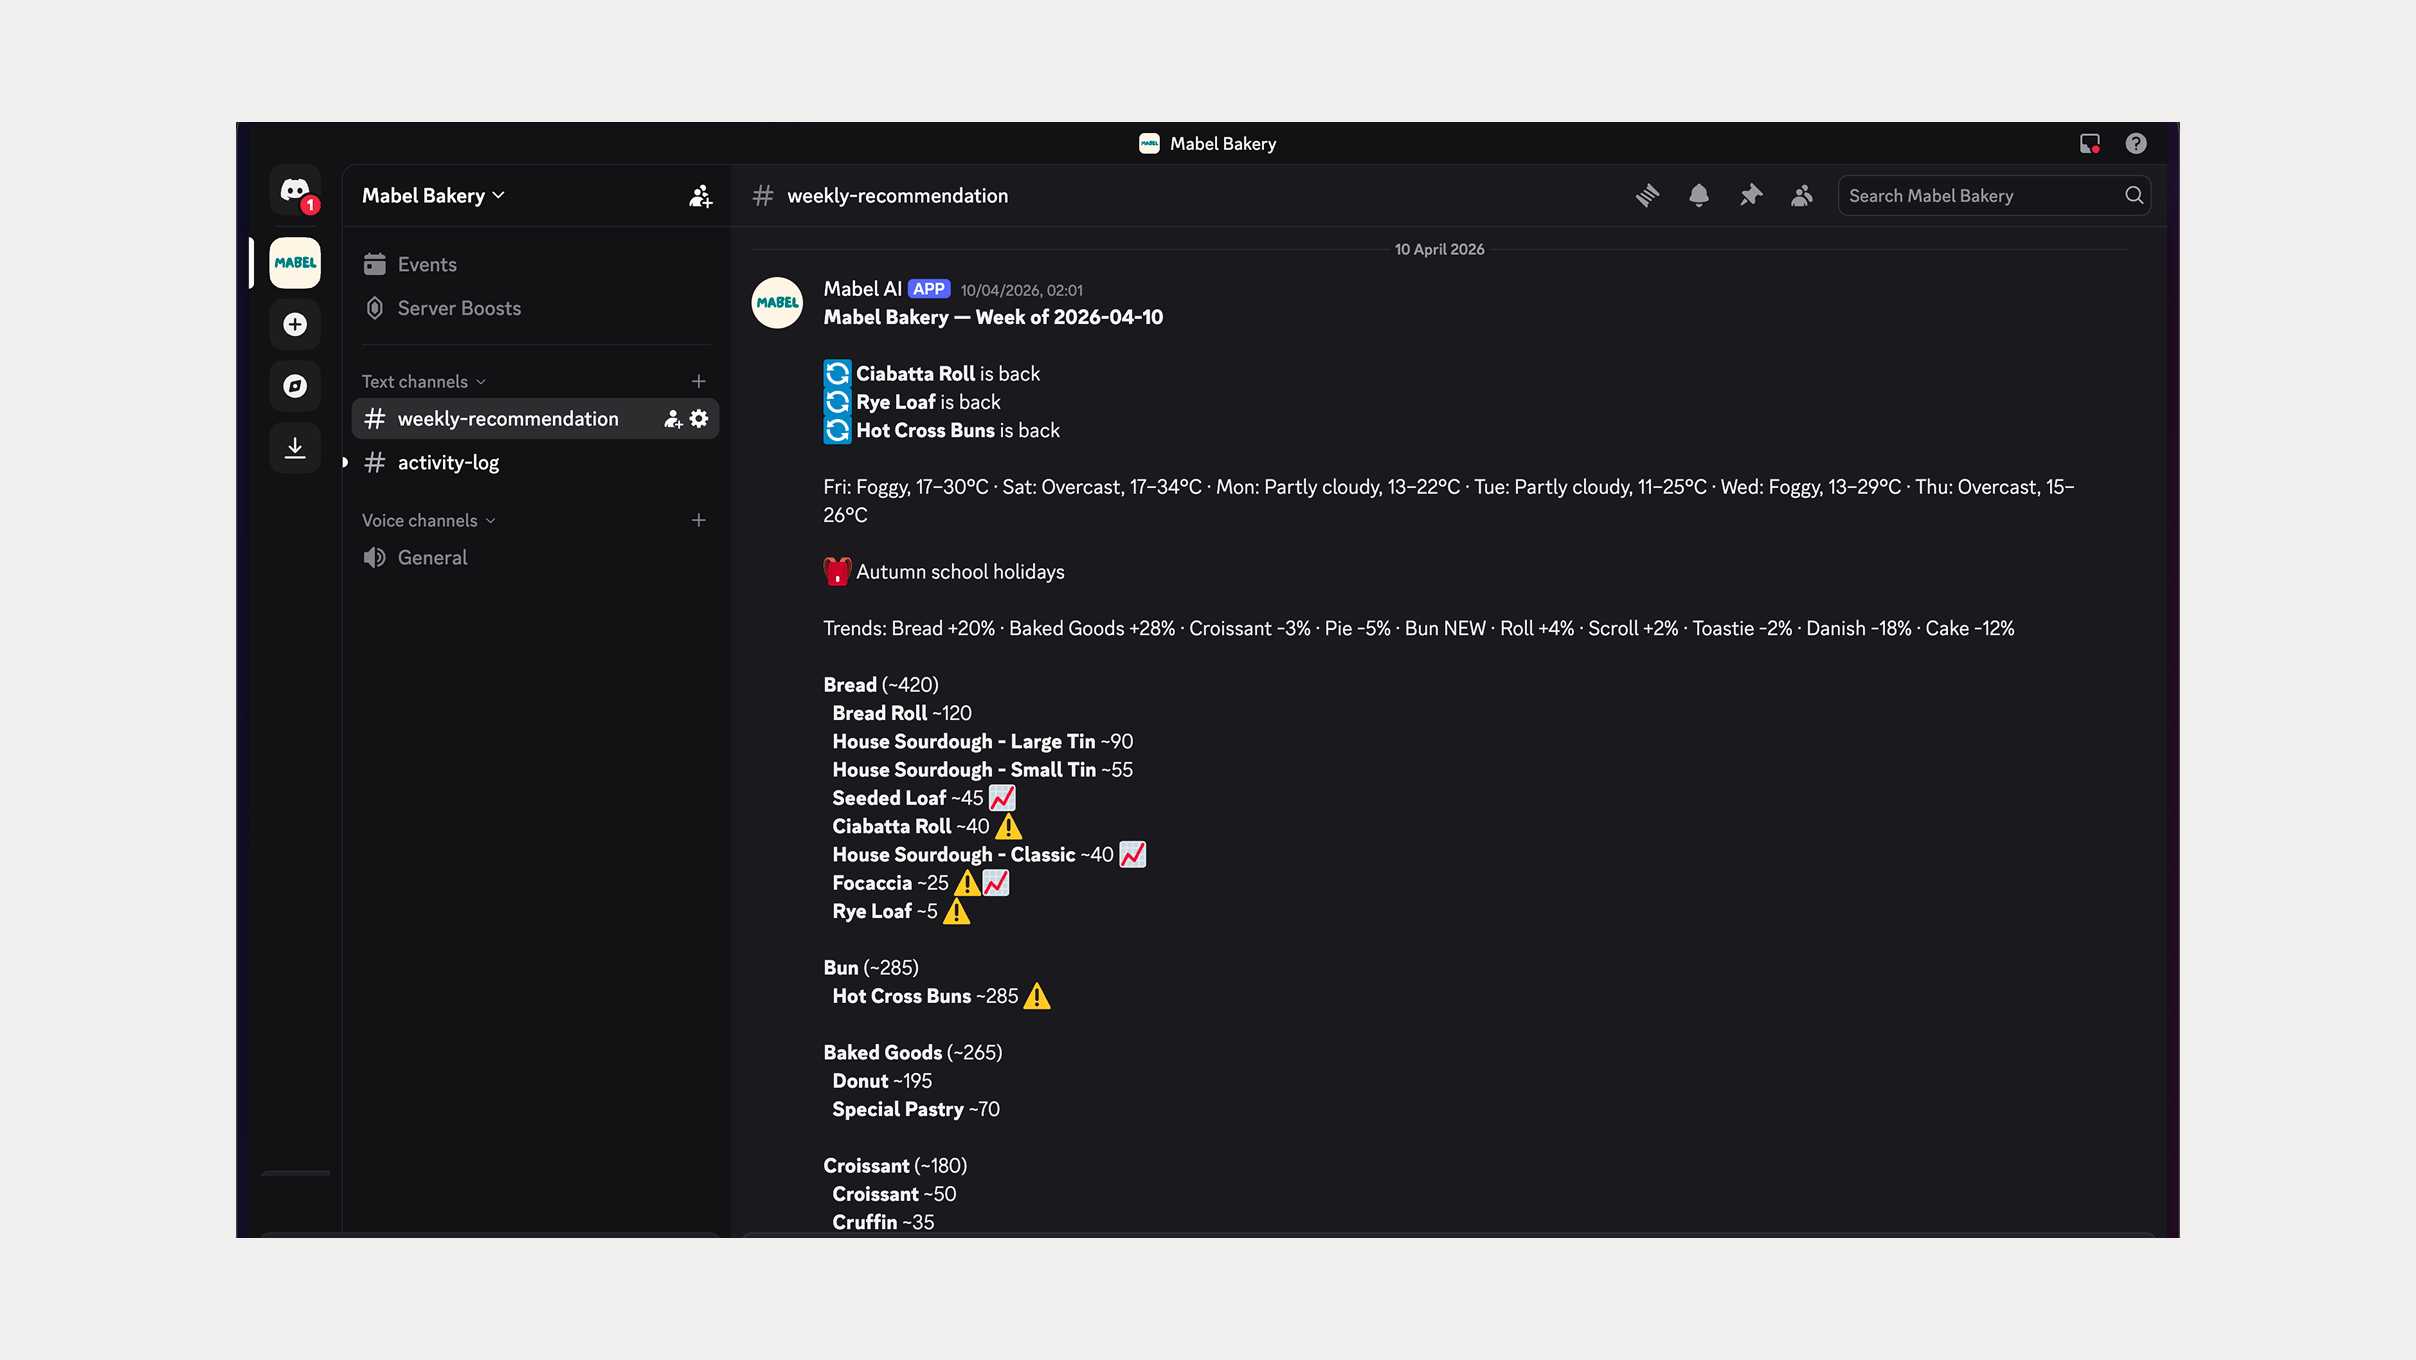
He sees what to make, how many, and when. The numbers are grounded in the last four weeks of his own sales. He can verify any of them in 30 seconds.
But accuracy alone isn’t the measure.
Two conditions, both must hold: the system lands within validated accuracy ranges, and Josh references the report as his starting point each week. That second condition is what makes this real. The system earns trust by being consistent and transparent.
What comes next
“The two main variables to control week-to-week for any food business are Cost of Goods as a percentage of sales, and Wages as a percentage of sales.”
That’s Josh. And that’s what the roadmap builds toward.
Five layers, each depending on the one before: recipes connect products to ingredients and production time, ordering turns the forecast into what to buy, costs flag margin erosion before it happens silently, and wages flag when the production plan exceeds the budget before the roster is locked. Forecast × recipes = what to order. Invoices × recipes = margin per product. Forecast × production time = labour required.
The engine I just built surfaces sales record patterns grouped how he thinks, in language he uses, at the moment he decides. Everything else depends on it. If after eight weeks the forecast signal isn’t reliable, we pause and iterate.
Code computes. Claude narrates. Mabel decides.
Every Friday, the system tells Josh what to make. He reads it, adjusts with feel, and makes his call.